// case study
EC2 Monitoring Tool
One-command Bash deployment of a lightweight Linux health dashboard to an EC2 instance, viewed privately through an SSH tunnel with no third-party agents, extra AWS services, or open web ports.
Completed· Runs on your own EC2 instance· Oct – Nov 2026
Overview
EC2 Monitoring Tool deploys a small Linux health dashboard to an Amazon EC2 instance with one command. From a terminal on their own computer, the user runs bash start.sh and answers three prompts: the instance’s public IP address or DNS name, the SSH username, and the .pem key file. The launcher connects over SSH, checks the instance, uploads a Bash metrics collector and a static dashboard, starts both, and opens the dashboard in the browser through an SSH tunnel.
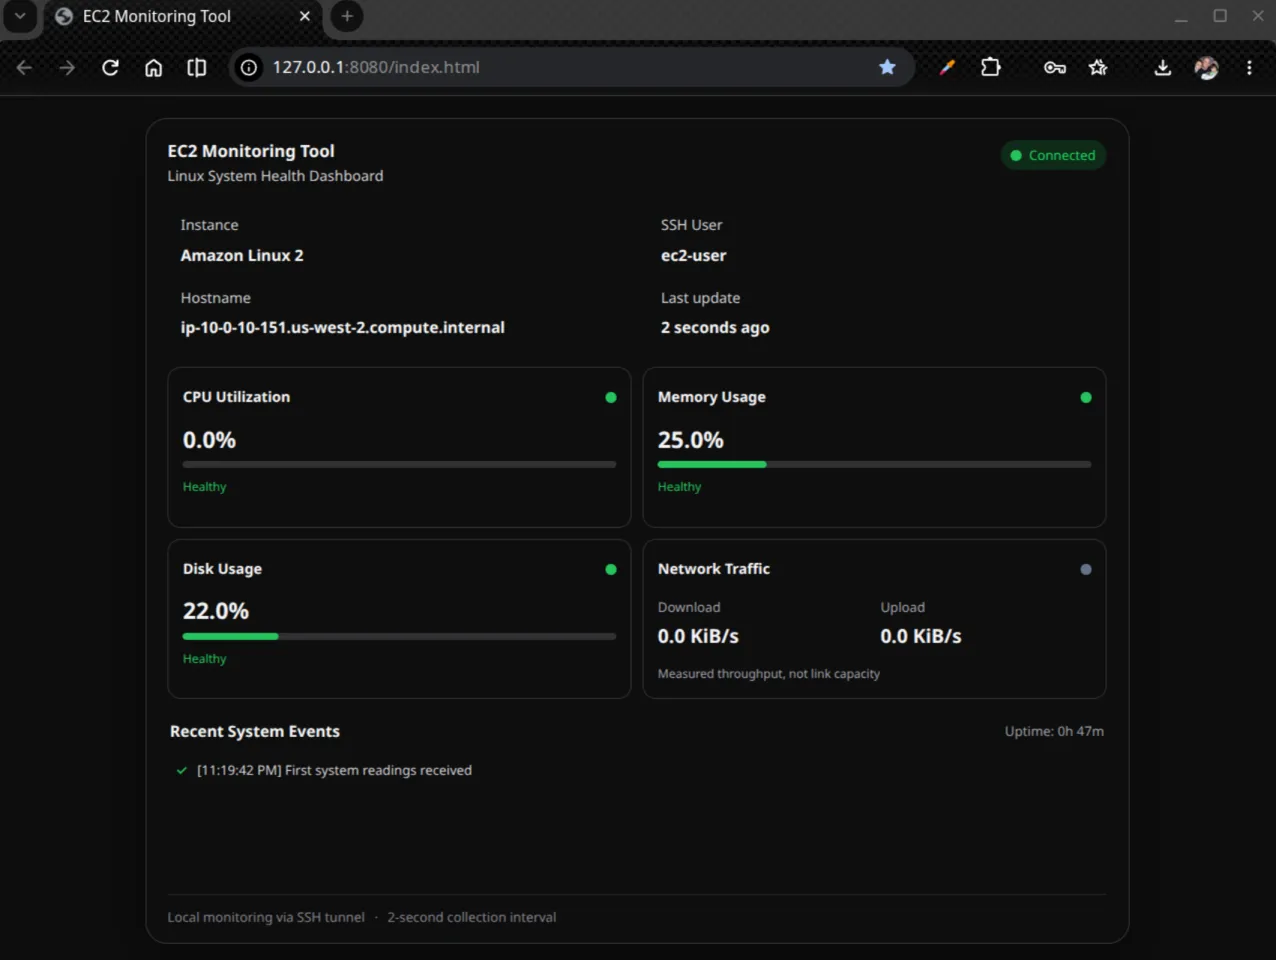
The dashboard shows CPU, memory, and disk usage with green, yellow, and red health states, along with network throughput, instance details, and a short feed of recent status changes. It refreshes about every two seconds.
Scope: This is a lightweight tool for watching one Linux instance while you work on it. It shows live readings only, with no history or alerting, and it isn’t a replacement for Amazon CloudWatch or a monitoring stack such as Prometheus and Grafana. There is no hosted demo: the dashboard runs on your own instance and is reachable only through your SSH tunnel.
Problem and motivation
The tool was built for temporary EC2 lab instances. Lab instances are recreated often, so the public IP address changes and the key file can change too. Checking on an instance’s health meant repeating the same manual work every time: connecting over SSH, creating folders, copying scripts up with scp, confirming the right tools were installed, and starting each process by hand.
The goals were to:
- Work with any instance address, username, and key file without editing configuration.
- Need no extra AWS services, IAM permissions, or third-party monitoring agents: if you can SSH in, it should work.
- Keep the dashboard private without opening another port to the internet.
- Reduce the whole setup to one command that a beginner can run, with clear pass and fail messages.
The project was also a hands-on way to practice Linux administration: reading kernel statistics, managing background processes, and working with SSH.
Technology stack
- Local launcher
- Bash
- OpenSSH (ssh
- scp)
- SSH local port forwarding
- curl
- On the instance
- Bash
- Linux /proc and /sys
- free
- df
- awk
- nohup and PID files
- Dashboard
- Python 3 http.server
- JSON
- HTML
- CSS
- JavaScript
- Environment
- Amazon EC2
- Amazon Linux 2
- Local shells
- Git Bash on Windows
- macOS
- Linux
Architecture and workflow
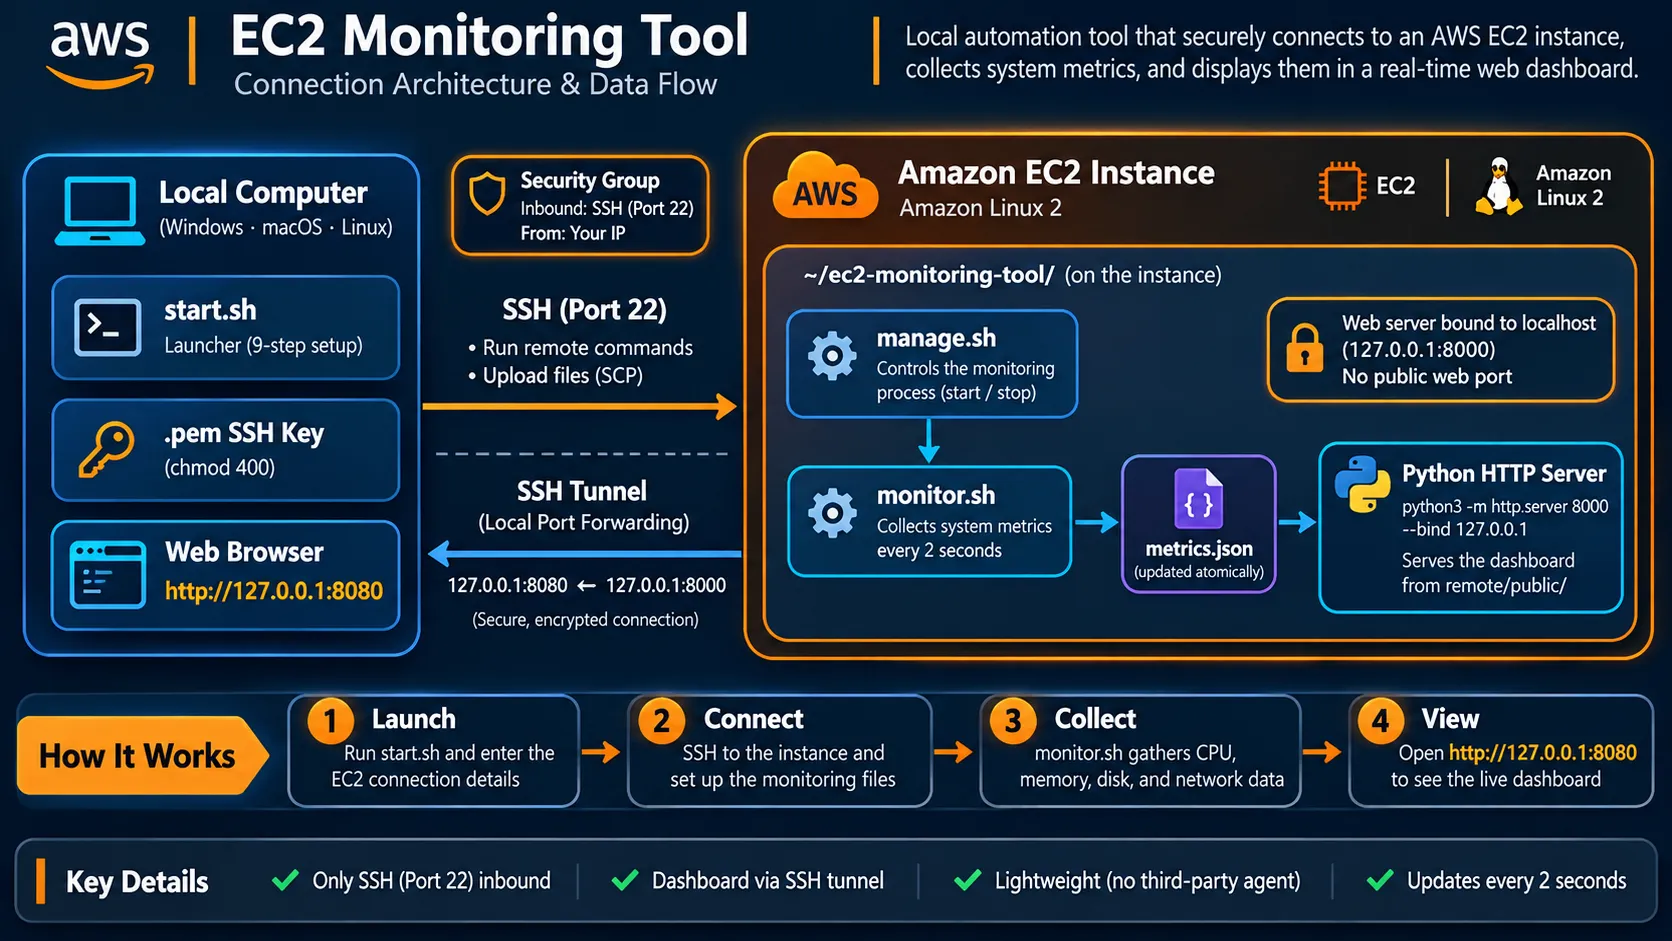
The tool has three parts, and everything between them travels over SSH.
On the local computer, start.sh is the launcher. It is written to run in Bash on Windows (Git Bash), macOS, or Linux, and uses the OpenSSH client for every connection: ssh to run commands on the instance, scp to upload files, and ssh -L for the tunnel.
On the EC2 instance, three pieces do the work:
monitor.sh, the collector, runs in a loop, reading CPU, memory, disk, and network statistics and rewritingmetrics.json.manage.shstarts, stops, and checks the collector as a background process.- Python’s built-in
http.serverserves the dashboard files andmetrics.jsonon port 8000, bound to127.0.0.1.
In the browser, app.js requests metrics.json every two seconds and updates the page.
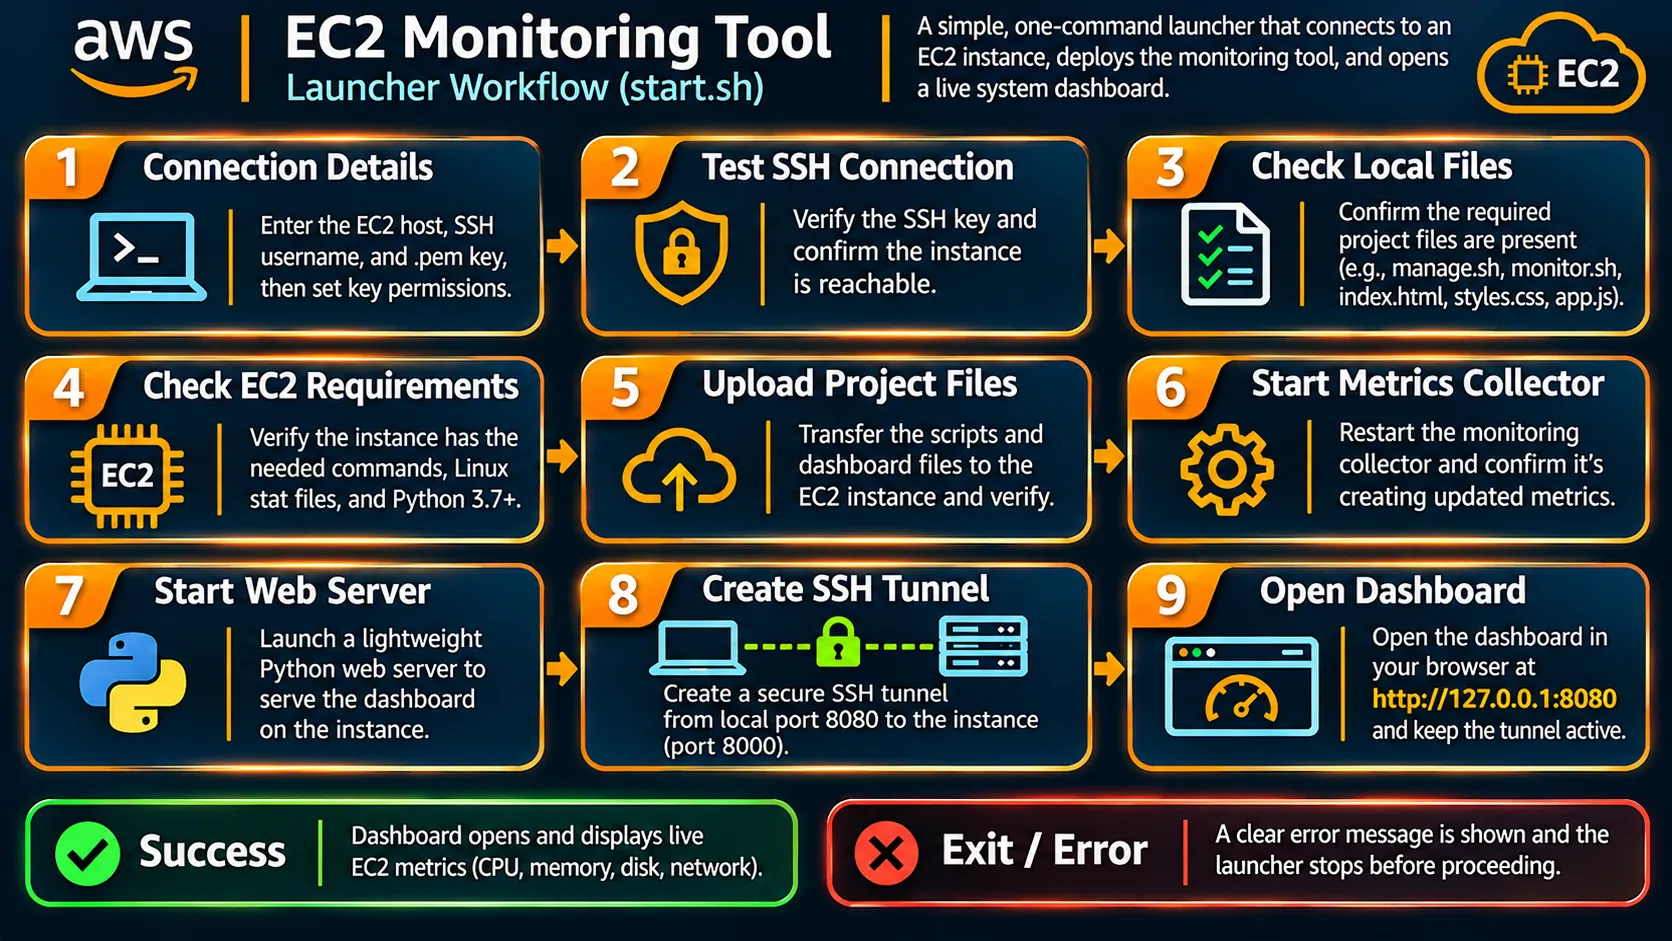
The launcher, step by step
Each stage must pass before the next one starts. Any failure stops the launcher with an [ERROR] message.
- Collect connection details. The launcher asks for the address and username, defaulting to
ec2-user. It looks for.pemfiles in the project folder, offering the key as the default when there is exactly one and listing them when there are several. It then sets the key’s permissions to400, because SSH refuses a private key that other users can read. - Test SSH. It runs a short command that prints the connected user and the Linux distribution, before anything is uploaded.
- Check local files. It confirms all five project files exist.
- Check the instance. It confirms that 15 required commands are installed, that the Linux statistics files in
/procand/sysare readable, and that Python is version 3.7 or later with its HTTP server module available. If anything is missing, it stops before changing anything on the instance. - Upload. It creates the project folders under
~/ec2-monitoring-tool/, uploads the two scripts and three dashboard files withscp, and confirms each file arrived and isn’t empty. - Restart the collector. It stops any running collector and starts a fresh one, so a redeploy always runs the latest script. It then confirms that
metrics.jsoncontains valid JSON and is still being updated. - Start the web server. It starts
http.serveron127.0.0.1:8000, or reuses one that is already running. It then fetchesindex.htmlandmetrics.jsonthrough the server and compares the served page with the file on disk, to make sure the server is serving the right folder. - Open the tunnel. It checks that nothing is already serving a website on local port 8080, opens the tunnel, waits until the dashboard responds through it, and opens the default browser on macOS and Windows. On Linux it prints the address to open.
- Hold the connection. The tunnel stays open while the launcher runs, and Ctrl+C closes it. The collector and web server keep running on the instance, so reconnecting is quick.
How metrics are collected
Each pass of the collector takes about two seconds:
- CPU.
/proc/statholds running totals of CPU time rather than percentages, so the collector reads it twice, one second apart, and calculates the share of time the CPU was busy. Time spent waiting on disk counts as idle. - Memory. It reads
free -band uses the available column rather than free, because Linux keeps spare memory busy as cache and releases it when programs need it. - Disk. It reads the percentage used on the root filesystem from
df -P. - Network. It finds the interface that carries the default route in
/proc/net/route, so it works whether the interface is namedeth0orens5. It then reads that interface’s received and transmitted byte counters in/sys/class/nettwice, one second apart, to calculate KiB per second. - Instance details. It also records the hostname, operating system, user, uptime, and a UTC timestamp.
The collector writes each reading to a temporary file, then moves it over metrics.json in a single step, so the dashboard never reads a half-written file.
How the data reaches the browser
The browser opens http://127.0.0.1:8080. The SSH tunnel forwards that connection to 127.0.0.1:8000 on the instance, where the Python server responds.
app.js fetches metrics.json every two seconds with caching disabled and rejects readings more than 12 seconds old. Each percentage card shows healthy below 70%, warning from 70%, and high from 90%. If fresh readings stop arriving, the status badge changes to “Disconnected / Stale”, the cards turn gray, and an event is logged. The event feed also records recoveries and threshold changes, keeping the latest seven.
Key engineering decisions
Bash and the tools already on the instance. The launcher and collector use Bash, standard Linux commands, and the statistics files in /proc and /sys. The only other requirement on the instance is Python 3.7 or later, for its built-in web server. There are no packages to install and no third-party monitoring agent: the only background processes are the tool’s own Bash collector and Python’s web server.
An SSH tunnel instead of an open port. The web server binds to 127.0.0.1 only, so it can’t be reached from the network even if a security group rule allowed it. Access goes through SSH local port forwarding, authenticated by the same key used to deploy. Port 22 is the only inbound port the instance needs.
A JSON file as the interface. The collector and the dashboard share one file instead of an API: the collector writes it and the static web server serves it. Each side can be developed and tested on its own, and checking the data takes a single python3 -m json.tool command.
Connection details on every run. Nothing about the instance is stored in configuration. Each run asks for the address, username, and key, so a recreated lab instance with a new IP address or key needs no file edits. The .pem files are listed in .gitignore so keys can’t be committed by accident.
Verify behavior, not just existence. Each stage checks real results before moving on: uploaded files must be non-empty, the JSON must parse and keep changing, the served page must match the deployed file, and the dashboard must respond through the tunnel.
Careful process management. manage.sh tracks the collector with a PID file. Because Linux reuses process IDs, a stale PID file could point at an unrelated program, so before reporting on or stopping the collector, manage.sh confirms from /proc/<pid>/cmdline that the process really is monitor.sh. It stops the collector with a normal termination signal and waits for it to exit, rather than forcing it with kill -9.
Safe to rerun. A redeploy restarts the collector so script changes take effect, reuses a web server that is already running after verifying it, and refuses to open a tunnel if something is already serving a website on local port 8080, such as a tunnel from an earlier run.
Challenges and troubleshooting
A data file that looked healthy after the collector stopped
What happened. During development, metrics.json was still present after the collector process had stopped. A check that only looked for the file would pass while the dashboard showed old data.
Resolution. The launcher now confirms that the file contains valid JSON, records its modification time with date -r, waits five seconds, and confirms the time has changed. The dashboard applies the same idea on its side: readings more than 12 seconds old mark the connection as stale.
Lesson. A health check should prove that a process is doing its job, not only that its output exists.
Handling differences between environments
- SSH clients. Newer OpenSSH clients print a warning about post-quantum key exchange when connecting to older servers. The launcher first silenced it by passing the
WarnWeakCryptooption to everysshandscpcommand, but older clients, including some on macOS, don’t recognize that option. The launcher now checks the option withssh -G, which parses settings without connecting, and adds it only when the local client supports it. The SSH settings were consolidated into one shared list used by every command, and the browser now opens withopenon macOS and PowerShell from Git Bash on Windows. - Python versions. The web server uses
http.server’s--directoryoption, which was added in Python 3.7. An explicit version check now stops the launcher with a clear message before anything is changed, instead of failing later when the server starts. - Network interface names. Interface names vary between instance types and images. An early version found the interface by parsing the output of the
ip routecommand. It was replaced with a direct read of the kernel’s routing table in/proc/net/route, which picks the interface carrying the default route.
Testing and validation
The project has no automated test suite or CI pipeline. Testing was manual, against real EC2 instances:
- The collector and
manage.shwere tested together by hand, starting, stopping, and checking their output, before the dashboard was built. - The full deployment was run end to end against an Amazon Linux 2 instance with Python 3.7.
- The launcher was originally written for Git Bash on Windows. macOS compatibility was added later, but it hasn’t been tested on a Mac.
- The launcher’s own checks work as an end-to-end smoke test on every run, covering SSH access, dependencies, uploads, live data, the served files, and the tunnel.
- The documentation covers checking scripts for syntax errors with
bash -nand validating the data withpython3 -m json.tool.
Results and lessons learned
A single bash start.sh and three answers turn a freshly launched lab instance into one with a live health dashboard, replacing a series of manual SSH, upload, and startup steps. The launcher checks every stage and stops with a specific message when something is wrong. The README and a printable Quick Start Guide walk new users through setup, each stage of the output, and common problems.
AI tools were part of the workflow: ChatGPT drafted the first version of the dashboard’s HTML and CSS from the original mockup, and Claude Code was used during development.
The main lessons:
- Linux exposes system health as files. Much of what a monitoring agent reports is available in
/procand/sys, but many values are running counters, so rates need two readings over time. - Localhost plus a tunnel keeps tools private. Binding a service to
127.0.0.1and reaching it over SSH avoids opening ports or changing firewall rules. - Background processes need lifecycle management. PID files, identity checks before stopping a process, and log files matter once nobody is watching the terminal.
- Checks should test behavior. Confirming that data is still changing caught a failure that a simple existence check missed.
- Usability is part of the engineering. Clear messages, safe reruns, and documentation make a tool usable by someone other than its author.
Future improvements
- Automatic restart after an instance reboot, for example by running the collector and web server as systemd services.
- Short-term history, so the dashboard can show trends instead of only the latest reading.
- More volumes, reporting on additional mounted filesystems, not only the root disk.
- Resilient network readings that recover from a counter reset instead of stopping the collector.
- Broader testing on more Linux distributions, and optional CloudWatch integration.