Projects

Self-directed engineering projects, with case studies covering architecture, deployment, and troubleshooting.

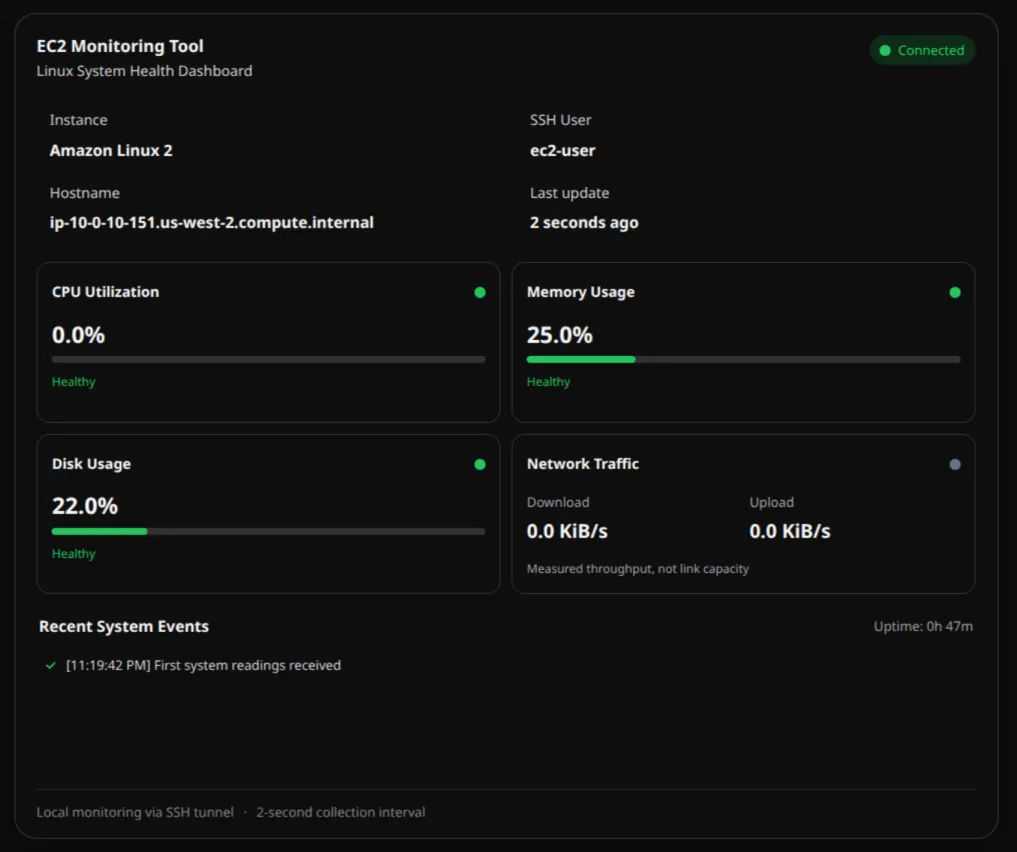
  • EC2 Monitoring Tool dashboard displaying Linux CPU, memory, disk, and network metrics.

    Completed· Runs on your own EC2 instance

    EC2 Monitoring Tool

    One-command Bash deployment of a lightweight Linux health dashboard to an EC2 instance, viewed privately through an SSH tunnel with no third-party agents, extra AWS services, or open web ports.

    • Checks SSH access, required tools, and the Python version before changing anything on the instance, then verifies the deployment and live data
    • Calculates CPU and network rates from successive /proc and /sys counter readings, written atomically to JSON
    • Dashboard bound to the instance's localhost and reached only through an SSH tunnel, so port 22 is the only inbound port
    • Bash
    • OpenSSH
    • Linux /proc & /sys
    • Python http.server
    • JavaScript
    • Amazon EC2
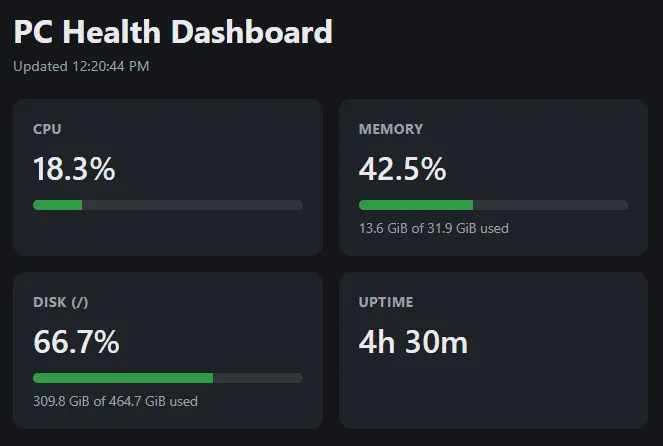
  • PC Health Dashboard showing CPU, memory, disk, and uptime metrics in a locally hosted monitoring interface.

    Completed

    PC Health Dashboard

    Local system-health dashboard for CPU, memory, disk, and uptime, with readings checked against Fedora's System Monitor and corrected where they differed.

    • Memory based on MemAvailable and disk usage calculated the way df reports it, so cached memory and reserved blocks don't distort the numbers
    • CPU sampled on a one-second server timer, independent of how many browser tabs are polling
    • Localhost-only server; tested on Fedora and Windows 11
    • Node.js
    • Express
    • systeminformation
    • JavaScript