// case study
PC Health Dashboard
Local system-health dashboard for CPU, memory, disk, and uptime, with readings checked against Fedora's System Monitor and corrected where they differed.
Completed· Nov 2026
Overview
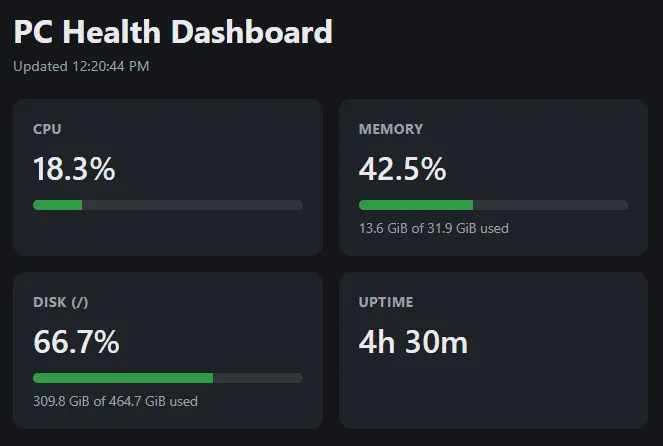
PC Health Dashboard is a small web app that shows a computer’s CPU, memory, and disk usage and its uptime. It runs on the machine it monitors: npm start launches a Node.js and Express server, and the dashboard is opened at http://localhost:3000. The page refreshes about every two seconds, and each usage bar turns orange at 70% and red at 90%.
The project had two goals: build a lightweight dashboard whose readings are accurate, and learn what it’s like to build a complete application with an AI coding agent. Claude Code, running inside VS Code, generated most of the code. The engineering work described here is in specifying, reviewing, testing, and correcting what it produced.
Scope: A single-machine tool with two runtime dependencies and no front-end framework or build step. It shows live readings only, with no history, alerts, or remote access. There is no hosted demo, because the dashboard reports on the computer it runs on.
Problem and motivation
Operating systems already ship with monitoring tools, so showing numbers wasn’t the hard part. The goals were to:
- Build a small, readable app with a JSON API and a plain JavaScript frontend, using as few dependencies as possible.
- Report numbers that agree with the operating system’s own tools, not just numbers that look plausible.
- Run on Linux, the primary target, and on Windows.
- Find out how to work with an AI coding agent: how to give it requirements, check its output, and stay in control of the code and the Git history.
Technology stack
- Server
- Node.js 18.15+
- Express 4
- systeminformation
- System readings
- /proc/meminfo
- Node.js os module
- fs.statfs
- Dashboard
- HTML
- CSS
- JavaScript
- Fetch API
- Tested on
- Fedora Linux
- Windows 11
- Development
- VS Code
- Claude Code
- Git
Architecture and data flow
Three files do the work:
metrics.jsreads the system’s statistics.server.jsserves the static dashboard frompublic/and exposes one endpoint,GET /api/metrics, which returns every reading in a single JSON response. It listens on127.0.0.1:3000only.public/app.jscalls that endpoint as soon as the page loads, then every two seconds, and updates the page.
Each reading has its own source:
- CPU: the
systeminformationpackage, sampled once a second on a server-side timer. - Memory: the total comes from
os.totalmem(). Available memory comes fromMemAvailablein/proc/meminfoon Linux, fromsysteminformationon macOS, and fromos.freemem()on Windows and as the fallback. - Disk:
fs.statfs()on the root path/, which needs Node.js 18.15 or later. - Uptime:
os.uptime().
In the browser, sizes are shown in 1024-based units (KiB, MiB, GiB), and uptime as days, hours, and minutes, such as 4h 30m.
Key engineering decisions
- Sample CPU on a timer, not per request. The operating system reports CPU time as running totals since boot, so usage has to be calculated from the difference between two readings. If readings were taken whenever the browser asked, the interval would depend on how many tabs were open. A one-second timer on the server keeps the interval steady however many people are watching. Until the first sample completes, the API returns
nullfor CPU and the page shows “Measuring…”. - Use available memory, not free memory. On Linux, the kernel uses spare RAM as disk cache and releases it when programs need it.
os.freemem()doesn’t count that cache, so a healthy machine can look nearly full. The dashboard uses the kernel’sMemAvailableestimate instead, the same figure as theavailablecolumn offree. Windows’ free-memory figure already counts that cache as available, so Windows usesos.freemem()directly. - Calculate disk usage the way
dfdoes. Filesystems can reserve some blocks for the root user. The dashboard counts as available only the blocks a normal user can use, and treats used plus available space as the capacity, so the percentage matchesdfon Linux. - Keep slow platform-specific work off the request path. On macOS,
systeminformationreads memory by running external commands, so it’s sampled on a two-second timer. Linux and Windows skip it: on Windows it would start PowerShell for every reading, only to return the same value asos.freemem(). - Localhost only. The server binds to
127.0.0.1, so the dashboard isn’t reachable from the network. - Fail without exposing details. If reading the metrics fails, the server logs the error and returns HTTP 500 with a generic message. The page shows “Cannot reach the server. Retrying…” and keeps polling until a request succeeds. A failed CPU sample is logged and the last good value is kept.
- No framework. The dashboard is plain HTML, CSS, and JavaScript with no build step, and it follows the system’s light or dark theme.
Challenges and troubleshooting
Checking the numbers against the operating system
Displaying a percentage is easy. Knowing it’s right is harder. After the first version was generated, its readings were compared with Fedora’s System Monitor, and the differences were used to correct the calculations. The commit “fix: improved system metrics accuracy” made two corrections:
- Disk capacity. The percentage already followed
df, but the “X of Y used” text used the filesystem’s full size, including the root-reserved blocks. The percentage and the text were calculated from different totals, so they didn’t agree. Capacity is now used plus available space, so both use the same figure asdf. - Unit labels. Sizes were divided by 1024 but labelled KB, MB, and GB, which are 1000-based units. They’re now labelled KiB, MiB, and GiB, so the labels match the calculation.
Neither problem would have caused an error. Both produced numbers that looked reasonable and were still misleading, and they were found by checking the output against a trusted tool rather than by reading the code.
macOS support
The first version calculated CPU usage from Node’s os.cpus() counters. When the dashboard was run on a MacBook, the page loaded but the CPU reading was missing. CPU sampling was then switched to systeminformation, and macOS memory readings were moved to it as well. The dashboard hasn’t been retested on a Mac since, so the change is implemented but it isn’t confirmed that it fixes the problem.
AI-assisted development
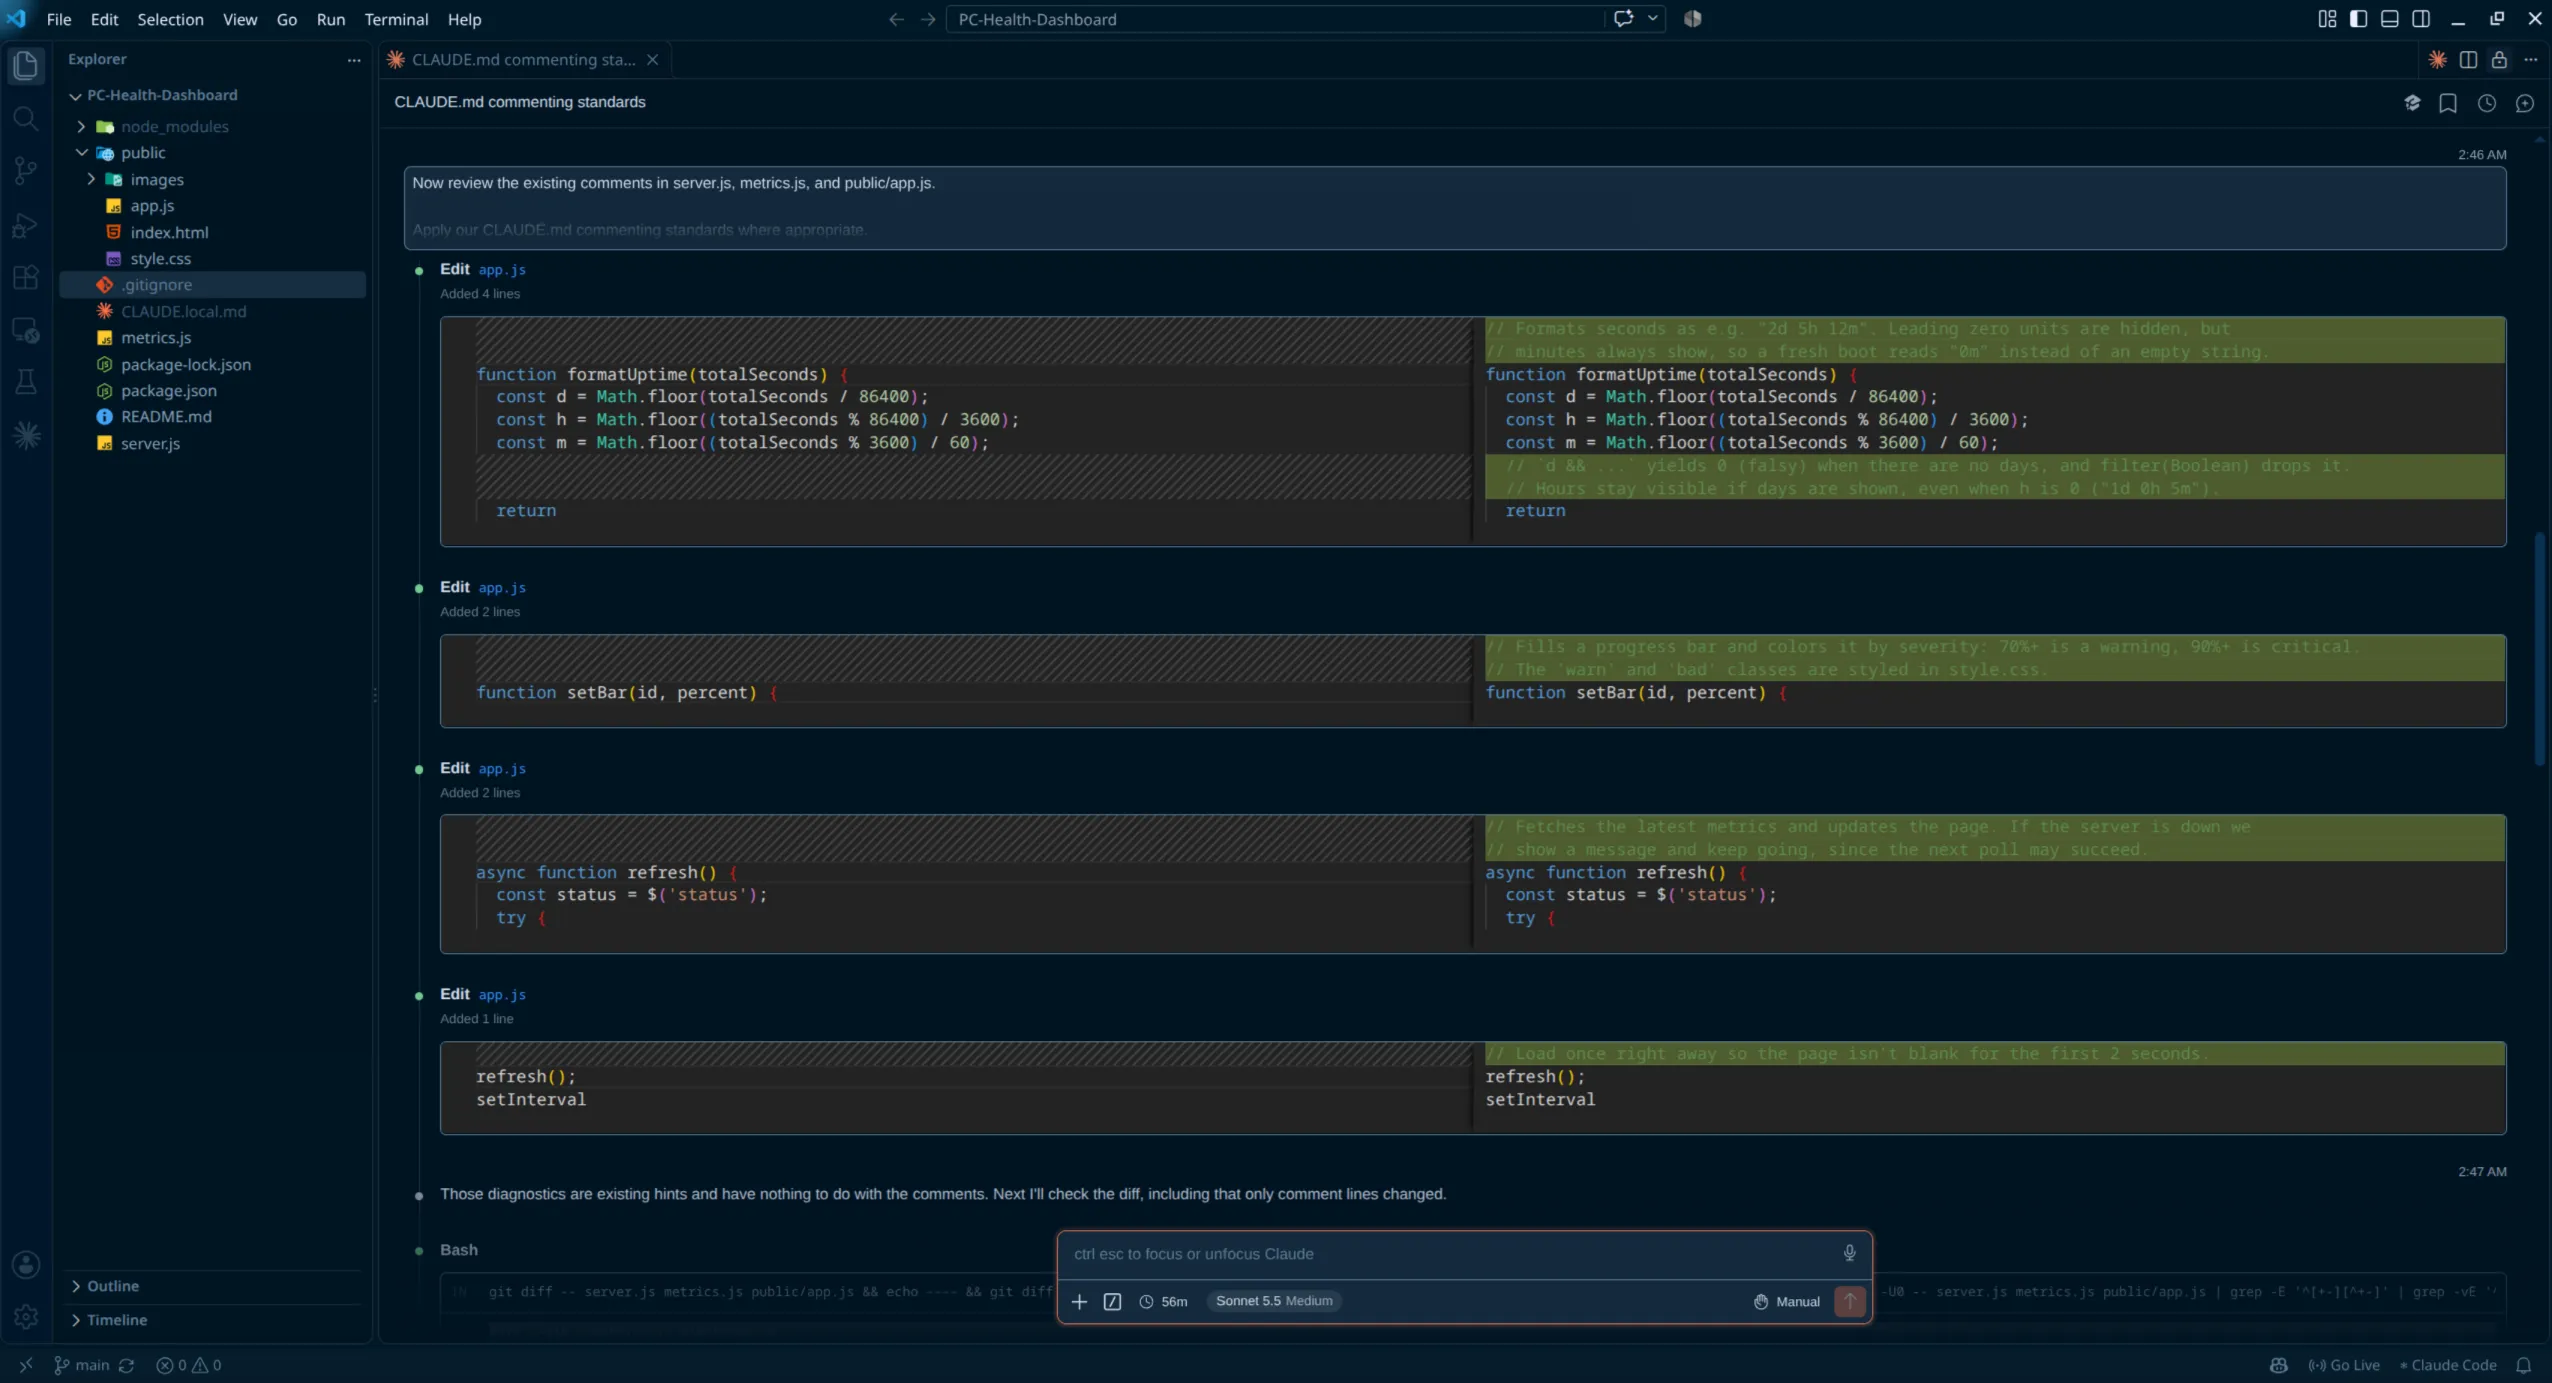
Claude Code generated the initial application from written requirements and assisted throughout development, including planning the architecture, troubleshooting, and reviewing code. The requirements, the review of every change, and the testing were not delegated: the running dashboard was tested independently, inaccurate readings were identified by comparing it with the operating system’s tools, and the corrections were directed from there. The practices that made this work:
- Review every change. Each proposed edit appeared as a diff and was inspected before moving on.
- Write project rules down. Standards such as the commenting style went into an instruction file so they didn’t need repeating. It started as
CLAUDE.mdand was later renamedCLAUDE.local.mdand excluded from Git, because it holds personal preferences rather than anything the project needs. - Give tasks a result that can be checked. In one pass, Claude was asked to improve the comments in the three source files without changing any executable code. Reviewing the diff confirmed that only comments had changed.
- Test independently. Running the dashboard and comparing it with Fedora’s System Monitor is what found the inaccuracies above. Generated code that runs and looks reasonable can still report the wrong number.
- Keep Git under human control. Claude was told not to commit or push until asked.
Testing and validation
Testing was manual:
- The dashboard was run on Fedora Linux and Windows 11.
- On Fedora, its readings were compared with Fedora’s System Monitor, which led to the corrections described above.
- macOS support was added in code after a missing CPU reading on a MacBook, but hasn’t been retested on a Mac.
There are no automated tests, CI pipeline, or performance benchmarks.
Results and lessons learned
The result is a working dashboard with two runtime dependencies. It starts with npm install and npm start, runs on Fedora and Windows 11, and reports memory and disk figures calculated the same way as the operating system’s own tools.
The main lessons:
- Showing metrics is easy; making them meaningful is the work. Free versus available memory, root-reserved disk blocks, and unit labels all produce numbers that look reasonable and are still wrong.
- Rates need two readings. CPU usage is the difference between running totals, and the server, not the viewers, should control the sampling interval.
- Check against a trusted reference. Comparing with the operating system’s own tools found problems that reading the code didn’t.
- An AI agent speeds up writing code, not judgment. Reviewing changes, testing the results, and deciding what “correct” means stayed with the developer.
- Small, checkable instructions work best. A narrowly scoped task followed by a diff review makes it clear exactly what changed.
Future improvements
- Retest on macOS to confirm the CPU reading now appears and the memory reading is correct.
- Clearer error messages that distinguish an unreachable server from a failed metrics read. Today both show “Cannot reach the server.”
- More drives, letting the user choose which disks or mount points to report instead of only
/. - Unit tests for the disk and memory calculations and the formatting functions.